Most business owners find out their debt-to-equity ratio matters at exactly the wrong moment, when a lender declines their loan application or an investor asks for it in a due diligence call and the number doesn’t hold up. By then, the impact has already occurred.
The debt-to-equity ratio is one of the first things lenders, investors, and acquirers look at when evaluating a business. It tells them, in a single number, how much of your business is funded by debt versus the money your owners have actually put in.
A ratio that’s too high signals risk. A ratio that’s too low can signal you’re not leveraging your capital efficiently. Getting it right and understanding what it means for your specific industry, is what this guide covers.

What the Debt-to-Equity Ratio Actually Measures
According to U.S. tax law regulated by Internal Revenue Service, the debt-to-equity ratio reflects the relationship between a company’s total indebtedness and its capital structure, reinforcing its role as a key measure of financial leverage.
The debt-to-equity ratio (D/E ratio) compares your total liabilities to your shareholders equity. In practical terms, it answers one question: for every dollar your owners have invested in the business, how many dollars of debt is the company carrying?
This is calculated by using the formula,
Debt-to-Equity Ratio = Total Liabilities ÷ Shareholders’ Equity
Total liabilities include everything your business owes short-term loans, long-term debt, lines of credit, accounts payable, accrued expenses, and any other obligations. Shareholders’ equity is what’s left after subtracting all liabilities from your total assets. It represents the owners’ stake in the business.
If your total liabilities are $400,000 and your shareholders’ equity is $200,000, your D/E ratio is 2.0. That means for every dollar of equity, the business carries two dollars of debt.
How to Calculate Your D/E Ratio: A Real Example
Say you run a mid-size marketing agency with the following balance sheet:
- Total assets: $750,000
- Total liabilities: $450,000
- Shareholders’ equity: $300,000
D/E Ratio = $450,000 ÷ $300,000 = 1.5
That’s your D/E ratio of 1.5:1, for every dollar of equity, the business owes $1.50 in debt. Whether that’s healthy or concerning depends entirely on your industry, growth stage, and how the debt was used.
If you don’t have clean, reconciled balance sheet figures, your D/E calculation will be wrong from the start. This is one of the most common issues Profitjets sees when reviewing financials for businesses preparing for fundraising or loan applications; the numbers exist, but they haven’t been maintained with the precision that outside reviewers expect.
What Is a Good Debt-to-Equity D/E Ratio
Capital-intensive industries like real estate, utilities, and manufacturing routinely operate at D/E ratios above 2.0 because their assets generate reliable cash flows that can service debt. A software company with a 2.5 D/E ratio and unpredictable ARR is a very different risk profile than a utility with the same ratio and 20-year contracted revenue.
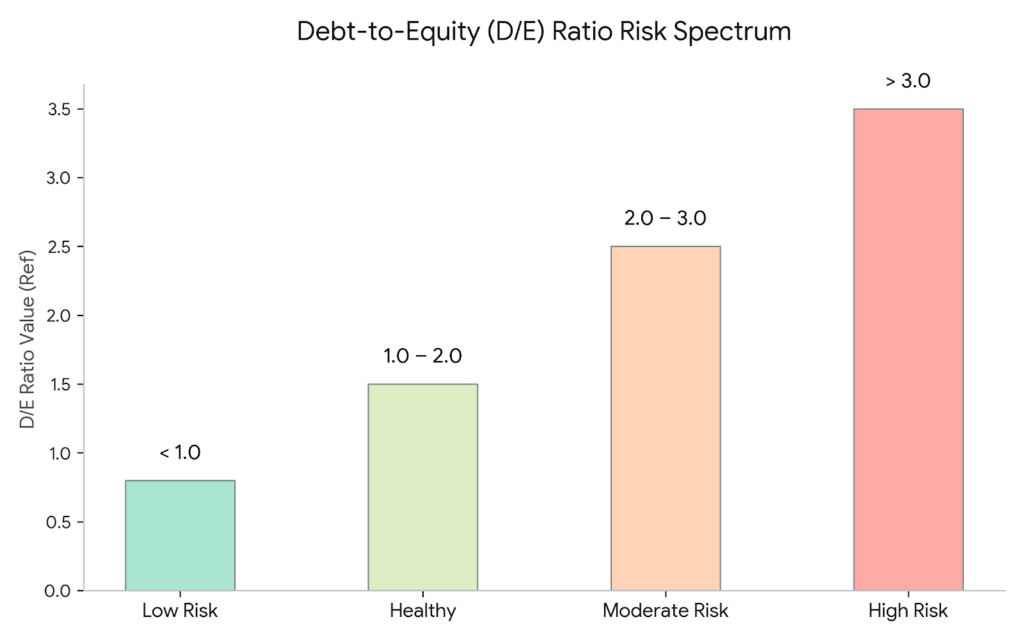
Figure 1 illustrates the relationship between debt-to-equity (D/E) ratio and financial risk across increasing levels of leverage
Below 1.0 indicates Low Risk
A ratio below 1.0 means the business has more equity than debt generally considered low risk and financially conservative. This is common in early-stage businesses or companies that have grown largely through retained earnings.
Between 1.0 to 2.0 indicates Healthy
A ratio between 1.0 and 2.0 is considered healthy for most industries. The business is using leverage to grow, but equity still provides a meaningful cushion. Most investors are comfortable in this range.
Above 2.0 shows Moderate Risk
A ratio above 2.0 starts to raise questions, especially in industries without predictable, recurring revenue. It signals high dependence on debt financing and can suggest vulnerability to interest rate increases or revenue downturns.
Above 3.0 flags High Risk
A ratio above 3.0 or 4.0 is a red flag for most outside reviewers unless there’s a specific, well-understood reason, like a capital-intensive infrastructure project with contracted revenue.
A good D/E ratio depends on your industry, but most businesses aim to stay within the 1.0–2.0 range.
Why Investors Care About the Debt-to-Equity Ratio More Than You Might Expect
When investors or lenders evaluate your debt-to-equity ratio, they’re not simply reviewing a metric, they’re assessing the overall resilience and flexibility of your business.
This ratio helps answer three critical questions:
- How much financial risk does the business carry?
- How much capacity exists to raise additional capital?
- What happens to equity holders if performance declines?
A high debt-to-equity ratio can significantly limit your options. In periods of cash flow pressure, lenders prioritize this metric when assessing risk. Businesses with elevated debt levels often face restricted access to funding and less favorable terms. Equity investors, in turn, become concerned about dilution, refinancing pressure, and whether future returns will be absorbed by debt obligations rather than distributed as value.
At the same time, an unusually low ratio such as 0.1, can also raise questions. It may suggest underutilization of leverage, overly conservative capital allocation, or missed opportunities to accelerate growth.
The objective is not to minimize the ratio, but to maintain a level that aligns with your industry, growth strategy, and capital structure and one that you can clearly justify to external stakeholders.
Good Debt vs Bad Debt: What It Means for Your Debt-to-Equity Ratio
Not all debt affects your debt-to-equity ratio in the same way. Investors and lenders look beyond the total amount—they assess how effectively that debt is being deployed.
Good Debt: Supports Revenue and Expansion
Your good debt is aligned with growth and expansion. It funds income-generating assets such as equipment, expansion, or initiatives that directly contribute to revenue. This type of leverage signals disciplined capital allocation and a clear return on investment.
Bad Debt: Signals Weak Cash Flow and Risk
Your bad debt is used to sustain operations without creating value. Relying on short-term or revolving credit to cover payroll or recurring expenses often indicates underlying cash flow pressure and weak financial control.
When evaluating your debt-to-equity ratio, external reviewers focus on the structure and purpose of debt, not just the headline number. Asset-backed debt with defined repayment schedules is viewed far more favorably than unsecured, short-term obligations with no clear path to repayment.
This is where financial reporting becomes critical. Clear classification of liabilities, distinguishing between term loans, capital leases, revolving credit, and other obligations provides the context needed to interpret your ratio accurately. Without that transparency, even a seemingly healthy debt-to-equity ratio can raise concerns.
Ultimately, it’s not the quantity of debt that defines risk, it’s the quality of that debt and the clarity with which it is reported.
What a High D/E Ratio Looks Like in Practice and What Causes It
The most common causes of an elevated debt-to-equity ratio aren’t reckless borrowing. They’re decisions that made sense in isolation but weren’t tracked against the full balance sheet picture.
Taking on a large equipment loan while retained earnings are low. Using a line of credit to fund operations during a slow season and rolling it forward rather than paying it down. Carrying deferred tax liabilities, lease obligations, or other non-obvious liabilities that inflate total debt figures without anyone realizing it.
Importantly, the solution is not always quick debt repayment. Reducing debt too quickly can strain working capital and disrupt operations. A more effective approach is to analyse and,
- Reassess the structure of existing debt
- Convert short-term obligations into longer-term financing where appropriate
- Evaluate opportunities to strengthen equity through retained earnings or capital infusion
- Review liability classification to ensure accuracy and avoid overstatement
A more strategic approach involves looking at whether any short-term debt can be converted to long-term financing (which improves the maturity profile without changing the ratio), whether equity injection through retained earnings or new investment is realistic, and whether certain liabilities are being double-counted or misclassified.
How to Improve Your Debt-to-Equity Ratio
Improving your D/E ratio comes down to two levers: reducing liabilities and increasing equity. In practice, the most effective approach combines both.
On the liability side:
- Prioritize repayment of high-cost, unsecured, or revolving debt
- Refinance short-term liabilities into structured long-term instruments
- Strengthen your debt profile to reflect stability and predictability
On the equity side:
- Retain earnings to build equity organically
- Reinvest profits instead of distributing them prematurely
- Consider equity infusion ahead of fundraising to improve balance sheet strength
Improving your debt-to-equity ratio is not about minimizing debt, it’s about creating a capital structure that supports sustainable growth and withstands external scrutiny.
What Profitjets Helps You Fix Before It Becomes a Problem
Growing businesses do not face a debt constraint instead they lack visibility. Key metrics such as the debt-to-equity ratio are often not tracked consistently, not benchmarked against industry standards, and only reviewed when required by lenders or investors.
By that stage, the ability to address gaps within a limited timeframe becomes a challenge. At Profitjets, we work with founders and business owners to ensure that critical financial metrics, including the financial ratios are accurate, current, and appropriately structured before they are subject to external review.
This includes:
- Reconciled and reliable balance sheets.
- Clear and consistent classification of liabilities and equity.
- Periodic financial reporting aligned with investor and lender expectations.
This approach ensures that your financial position can be presented with clarity, confidence, and credibility.

Frequently Asked Questions (FAQs)
What is a good debt-to-equity ratio for a business?
A good debt-to-equity ratio typically falls between 1.0 and 2.0, indicating a balanced use of debt and equity. However, the ideal range varies by industry, with capital-intensive sectors often operating at higher ratios. A strong debt-to-equity ratio reflects a balance between growth and financial stability.
How is the debt-to-equity ratio calculated?
The debt-to-equity ratio is calculated by dividing total liabilities by shareholders’ equity:
D/E Ratio = Total Liabilities ÷ Shareholders’ Equity.
It measures the level of capital used by a business.This formula helps businesses track leverage and maintain a healthy capital structure.
Why is the debt-to-equity ratio important for investors?
Investors use the debt-to-equity ratio to assess financial risk, capital structure, and borrowing capacity. It helps determine whether a business can sustain growth and manage debt effectively. It is a key metric used in evaluating a company’s financial health and investment potential.
Is a high D/E ratio always a bad sign?
Not necessarily. A high debt-to-equity ratio can be acceptable in industries with stable and predictable cash flows. However, in volatile sectors, it may indicate higher financial risk and reduced flexibility.
How can a company improve its D/E ratio?
A company can improve its debt-to-equity ratio by reducing liabilities, increasing retained earnings, raising equity capital, and restructuring short-term debt into long-term obligations. Improving this ratio strengthens financial stability and investor confidence.