You are calculating TAM because you need a market size number you can defend, not one you can make work. The hard part is not the math. It is defining the market boundary and choosing the right unit so your TAM matches how you get paid.
- TAM is a ceiling, not a forecast. It answers “how much demand exists if every eligible unit bought” – not “how much we will win.”
- Lock your revenue unit first. If you count companies but charge per seat or location, your TAM will look precise and still be wrong.
- Bottom-up TAM (eligible units x ACV) is the defensible version. Top-down is a sanity check, not a replacement.
- Any per-firm U.S. B2B TAM has a hard ceiling of roughly 5.9 million employer firms. If your model blows past that, the problem is definition.
- When top-down lands at billions and bottom-up supports tens of millions, do not inflate the number. Treat the gap as a definition problem.
Bottom-Up vs. Top-Down: Which Approach to Use
Before touching spreadsheets, decide which approach fits your situation. The table below shows when each method works and where each one typically breaks.
| Approach | Start With | Core Math | Best For | Common Failure Mode |
|---|---|---|---|---|
| Bottom-Up | Countable eligible units in your ICP | Eligible units x annual value per unit (ACV/ARPA) | Defensible TAM that maps to pricing and pipeline | Wrong unit (accounts vs. seats/locations) or unclear eligibility |
| Top-Down | Credible category total (revenue/spend/units) | Category total x eligibility share x monetization alignment | Category context and early-stage sanity check | Treating TAM like a forecast or counting ineligible buyers |
| Reconcile Gaps | Both models in the same unit and buyer definition | Align unit, eligibility, and pricing basis until ranges converge | Explaining why numbers differ and fixing definition leaks | Anchoring to the bigger number instead of rewriting the TAM question |
Pick the Unit That Matches Revenue
Even perfect math fails if your TAM does not hold up when someone asks how you bill. The fastest way to lose credibility is to count on one thing and monetize another.
Before you touch spreadsheets, decide what one sale is in your model. If you count companies but you charge per location, per seat, or per transaction, your TAM will look precise and still be wrong. A bookkeeping SaaS priced per entity can use employer firms as the unit, but a field-service platform priced per technician should use tech seats, not contractors in the U.S.
Choose the unit that directly drives what lands on the P&L, then build your TAM as units x annual value per unit. If you cannot write your invoice line item in one noun, you are not ready to calculate TAM yet.
| Revenue Unit | Counted As | Best Fit When You Price | Quick Example Invoice Line |
|---|---|---|---|
| Account (company) | Companies/entities | Per company subscription | $1,500/year per company |
| Location | Stores/clinics/branches | Per site/branch | $250/month per location |
| Seat (user) | Employees/agents/technicians | Per user/technician/agent | $30/month per technician |
| Transaction | Orders/shipments/claims | Per usage event | $0.50 per shipment |
Define TAM vs. Planning Reality
TAM is a ceiling, not a forecast, and confusing the two can blow up planning before budget vs. actuals even runs. It answers “how much demand exists if every eligible unit bought at the annual value you modeled?” Planning reality answers a different question: “how much of that demand can you actually reach, convert, and serve in your time horizon?”
For example, you might model a B2B product that could fit most U.S. employer firms and use that as a hard upper bound (the Census Bureau reports about 5.9 million employer firms). But if your go-to-market is outbound to CFOs in multi-location trades businesses, your reachable market this year may be limited by list quality, sales capacity, and whether prospects even see you as a credible option.
| Constraint | The Question It Answers | What It Limits in Practice |
|---|---|---|
| Reach | How will these buyers hear about you in 12-24 months? | Awareness and lead flow |
| Access | Can you reach the decision-maker, or are you blocked? | Channel feasibility and sales motion |
| Capacity | Can you sell and deliver at the implied volume? | Headcount, onboarding, and throughput |
| Eligibility | Who fits on paper but will not buy today? | Integrations, compliance, budgets, switching costs |
If your story leans on “we will just get 1%,” you still need to show how reach and capacity make that capture rate plausible. A huge TAM will not save you if you are effectively invisible to the buyers you are counting.
How to Calculate TAM Bottom-Up
Bottom-up TAM is the version you can defend in a finance room because it starts with observable units and your actual monetization. The core construct is simple:
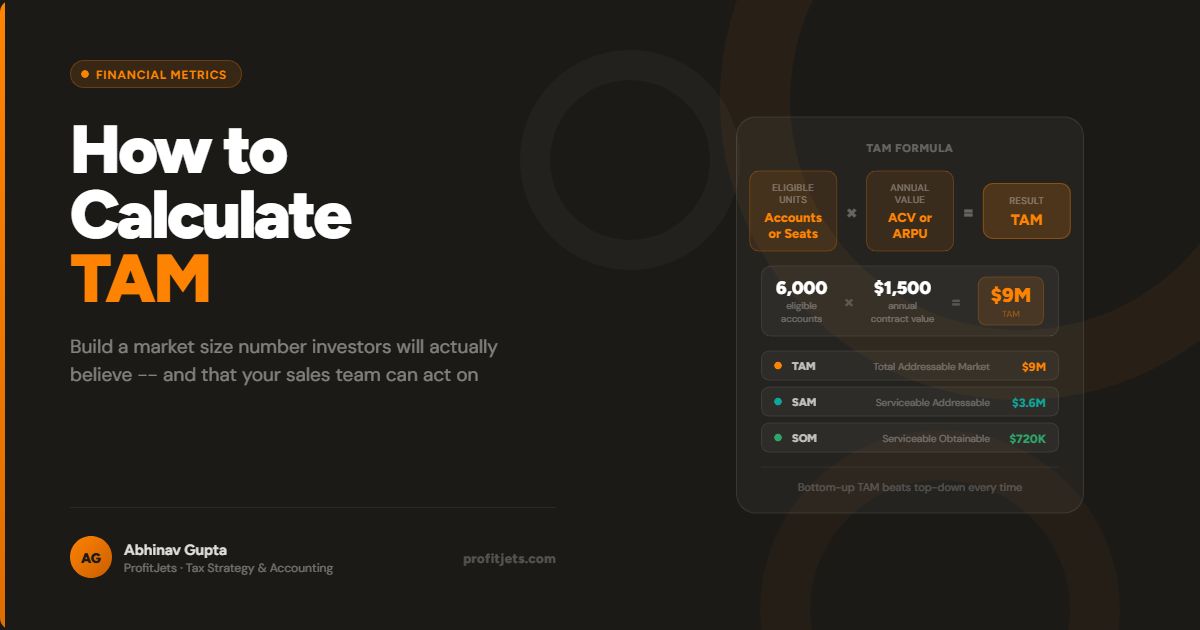
TAM = Number of Eligible Units x Annual Value Per Unit (ACV/ARPA)
If you can build a list or proxy count of 6,000 eligible firms in your target size band at $1,500 ACV, your bottom-up TAM is 6,000 x $1,500 = $9M. That is not a sales plan; it is the ceiling for that defined buyer and pricing model. If someone pushes you to just use the whole construction market, you are being nudged toward a narrative number, not a usable model.
Keep the same structure and add a simple mix layer. Model 70% on a $1,200 tier and 30% on a $2,400 tier, or include an attach rate for an add-on. Write the unit count source and the pricing logic next to the math so any gap you see later is a segmentation mismatch you can fix.
How to Calculate TAM Top-Down
Top-down TAM starts with a credible total (industry revenue, total units, or total spend) and then narrows it using explicit segmentation filters until the remainder matches your definition of an eligible buyer. It is useful when you cannot reliably count accounts yet. It only works if you treat it as a ceiling.
Mechanically: Total category size x eligibility share x monetization alignment. If a reputable source says U.S. businesses spend $2B/year on a category of compliance tools, you carve out your TAM by applying defensible slices – SMBs under 200 employees, regulated sub-industries you support today – then adjust for the fact that you price per location. If your product only fits multi-location operators, you do not get to count the single-location majority just because they are in the same NAICS code.
Use top-down as a sanity check against your bottom-up model, not a replacement for it. If top-down lands at billions while bottom-up supports only tens of millions, resist inflating TAM. Treat the gap as a signal that your segmentation or pricing basis does not match the market total you anchored to.
Reconcile Top-Down vs. Bottom-Up Gaps
A founder walks into a partner meeting with a $3B market slide, and the first question is: then why does your account list only support $40M? The awkward silence usually traces back to one mismatched definition.
When your top-down comes out in billions and your bottom-up lands in tens of millions, do not treat it as a marketing problem. Treat it as a definition problem. The gap usually means you are anchored to a category total that does not match what you sell, who can buy today, or how money flows in the category.
Segment Your TAM by ICP
A single headline TAM is rarely the number that should drive your next decision. Averaging buyers with different budgets, compliance needs, and buying motions usually produces pricing and a sales motion that fits nobody.
Keep the same TAM math and split the unit count and ACV by the ICP cuts that change how you win. Start with 2 to 4 ICP segments, each defined by criteria that actually change price and motion:
- Firmographics: size band, multi-location vs. single-location, industry where the pain is acute
- System environment: required platform (QBO vs. NetSuite), tech maturity, integration needs
- Buying process: owner-led purchase vs. CFO-led committee, procurement, security review
Once you segment your TAM this way, you can set packaging per segment, decide whether outbound is viable, and stop defending a blended number that depends on buyers you will never pursue.
Make TAM Operational With SAM and SOM
Your TAM becomes useful the moment you force it to answer an operating question: how much of this market can we realistically pursue with our channels, team, and product constraints?
- SAM (Serviceable Addressable Market): the portion of your TAM you can actually serve and reach, given your current ICP, geography, integrations, and go-to-market
- SOM (Serviceable Obtainable Market): the share of that SAM you can capture in a specific window, based on conversion math and capacity, not optimism
If your SAM is 8,000 eligible accounts at $3,000 ACV, that is a $24M SAM. At a 0.5%-2% capture rate for an early motion, your SOM is 40 to 160 accounts, or $120K to $480K ARR. With a 20% close rate, you need 200 to 800 sales-qualified opportunities. Now pressure-test whether your AE capacity supports that or not.
Need help sizing your market and building a finance-ready go-to-market model?
Talk to a CFO AdvisorStress-Test Your TAM Quickly
Before you polish a TAM slide, sanity-check it so you do not end up with spreadsheet theater. Start with a hard ceiling: if you are selling B2B per firm in the U.S., your unit count cannot exceed roughly 5.9 million employer firms, and most niches are a small fraction of that.
Then sanity-check pricing: if your model needs $10K ACV from businesses that typically buy $99 tools, the market is really your packaging problem. Finally, pressure-test reach: if I had a perfect product, could I realistically get in front of these buyers in 12-24 months? If your answer depends on being discovered everywhere while you are actually invisible outside a few channels, your effective addressable market is smaller than your math.
Frequently Asked Questions
What data sources count for a defensible TAM?
How often should you update your TAM model?
How do you handle multi-tier pricing without hand-waving?
What if I cannot find a clean count of eligible buyers?
Anu Gupta
Anu writes practical finance and strategy guides for founders and operators who need numbers they can defend in front of investors and finance teams.