
What a customer is worth over the whole relationship decides how much it is rational to spend winning one, which makes it one of the most useful figures a growth business has.
It is also one of the easiest to flex. Extend the horizon, assume better retention, use revenue instead of margin, and the number supports almost any level of spending.
This covers the formulas in use, the inputs each depends on, how it is read against acquisition cost, how to improve it, and why cohorts tell you more than an average ever will.
Customer Lifetime Value (LTV or CLV) is the total gross profit a business expects to earn from a customer over the entire relationship. It is the counterpart to CAC: together they determine whether your business model creates or destroys value.
LTV Formulas
Simple LTV
LTV = ARPU x Gross Margin % x Average Customer Lifetime (months)
Example: $100/month ARPU, 70% gross margin, 18-month average customer life = $100 x 70% x 18 = $1,260
Predictive LTV (Using Churn Rate)
LTV = (ARPU x Gross Margin %) / Monthly Churn Rate
Example: $100/month ARPU, 70% gross margin, 2% monthly churn = ($100 x 70%) / 2% = $3,500
The predictive formula assumes a steady-state customer relationship. At 2% monthly churn, average customer life is 50 months (1 / 2%).
The honest use of this number is as a ceiling on what it is rational to spend. The dishonest use is starting from what you already spend and extending the horizon until the number clears it. Both produce a figure; only one is evidence.
Abhinav Gupta, CPA, CA, MBA · LinkedInLTV Calculator: Key Inputs
| Input | How to Find It |
|---|---|
| ARPU (Average Revenue Per User) | Monthly recurring revenue / number of active customers |
| Gross Margin % | Gross profit / revenue; use subscription-layer margin, not blended |
| Monthly Churn Rate | Customers lost in month / customers at start of month |
| Average Customer Lifetime | 1 / Monthly Churn Rate (in months) |
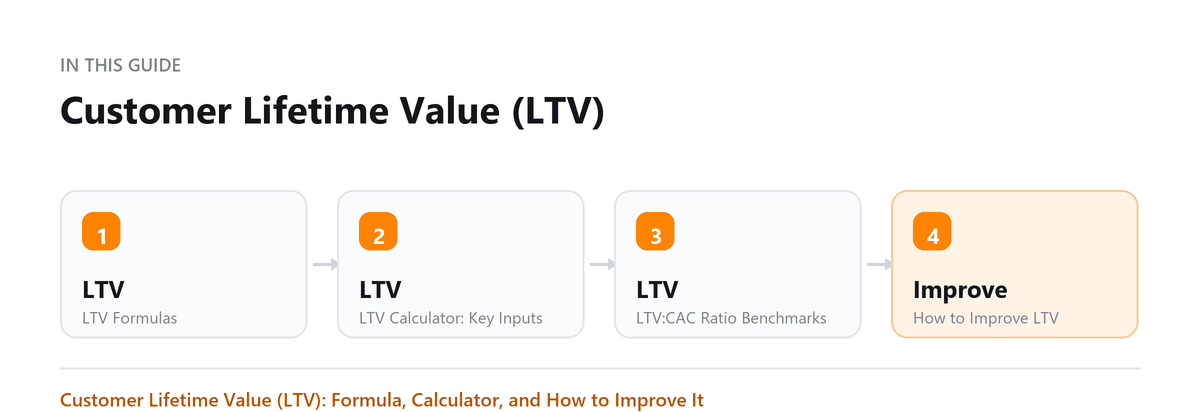
LTV:CAC Ratio Benchmarks
| LTV:CAC Ratio | Interpretation |
|---|---|
| Below 1:1 | Losing money on every customer, unsustainable |
| 1:1 to 3:1 | Marginal, reduce CAC or improve LTV before scaling ad spend |
| 3:1 | SaaS venture benchmark, healthy enough to grow |
| Above 5:1 | Possibly under-investing in growth |
How to Improve LTV
1. Reduce Churn
- Churn is the most powerful lever: halving monthly churn from 4% to 2% more than doubles LTV
- Invest in onboarding: customers who reach their 'aha moment' in the first 30 days churn at a fraction of the rate
- Build sticky integrations and workflows that increase switching cost
2. Upsell and Cross-Sell
- Expansion revenue increases ARPU without acquiring a new customer
- Net Revenue Retention (NRR) above 100% means your existing base grows even with some churn
3. Improve Onboarding
- Shorter time-to-value reduces early churn (the most common churn window)
- Customer success check-ins at Day 7, Day 30, and Day 90
Cohort LTV vs Average LTV
Average LTV uses blended averages and can mask deteriorating customer quality. Cohort LTV tracks the actual cumulative gross profit from each acquisition cohort (e.g., all customers acquired in January 2024) over time. A healthy business shows cohort LTV curves that are stable or improving.
Where the Number Gets Used, and Misused
Lifetime value exists to answer one question: how much is it rational to spend to win a customer. Used that way it is the most useful figure in a growth business. Used any other way it tends to become a justification looking for a decision, and that is worth watching for, because the calculation is easy to flex and hard for an outsider to challenge.
The honest use is a ceiling. If a customer is worth a certain margin over the period you can actually observe, then spending more than that to acquire one destroys value however good the growth looks. The dishonest use is the reverse: starting from what you are already spending, and extending the horizon or the assumed retention until the number clears it. Both arrive at a figure. Only one of them is evidence.
The practical safeguard is to hold the inputs still. Fix the horizon, fix whether you are using margin or revenue, and fix which customers count, then change them only deliberately and say so when you do. A figure that moves every time it is presented is one nobody will trust, including you.
- Publish the assumptions next to the number, every time, so a change is visible rather than buried
- Use margin rather than revenue, because revenue you have to spend to serve is not value to the business
- Compare against acquisition cost drawn from the same period, not against a figure from a quieter quarter
- Recheck it when pricing, packaging or the channel mix changes, since all three move it and none announces itself
Book a free consultation and we will get the numbers straight.
Frequently Asked Questions
Should LTV include gross margin or revenue?
Gross profit LTV is the correct metric for comparing to CAC, you need to know the profit generated, not just revenue. Using revenue LTV overstates value and leads to under-pricing customer acquisition.
What is a good LTV for a SaaS startup?
It depends on CAC. If CAC is $1,000, LTV of $3,000 or more gives the 3:1 ratio. The absolute number matters less than the ratio and the payback period.
How does net revenue retention relate to LTV?
NRR above 100% effectively extends LTV because existing customers grow their spend over time. A 120% NRR company has fundamentally better LTV than a 90% NRR company with the same initial ARPU.
How long a period should the calculation actually cover?
A period you have data for, extended no further than you can defend. Projecting a customer relationship over many years on the strength of a few months of history produces a number that justifies almost any acquisition spend, which is precisely why it is unreliable. Capping the horizon at something you have observed, and saying so, keeps the figure useful for decisions rather than for persuasion.
Why does the figure differ so much between cohorts?
Because the customers were different and so was what you sold them. Pricing changes, a new channel, a promotion, a product change: each produces a cohort that behaves unlike the ones before it. An average across all of them describes a customer who does not exist. The cohorts are the point, and a cohort that retains materially better than the others is usually the most useful thing the calculation will tell you.

Written by
Abhinav Gupta, CPA, CA, MBA
Abhinav works with business owners across the US on industry-specific bookkeeping, from dental practices and restaurants to construction and e-commerce. He writes about what each trade's books actually need. Connect on LinkedIn
Free consultation
Want Books You Can Rely On?
Book a free consultation and we will get the numbers straight.