ROR is the percent change in value measured against capital at risk over a defined period. Name the period, name the base, include every cash flow, and annualize with compounding rather than division. This guide shows you how to get every step right.
Key Takeaways
- ROR = net gain during the period divided by beginning value. Always name the period and the base, or the number is useless for comparison.
- Simple division converts multi-year returns to an annual rate incorrectly. Compound math gives the accurate figure.
- When cash moves substantially in or out during the period, holding-period ROR breaks. Switch to money-weighted return (IRR methodology).
- ROR, ROI, and IRR each solve a different problem. Using the wrong one for a decision can flip the ranking between two options.
- Tie ROR to a real business outcome (cash, margin, capacity) before using it to green-light spending.
What Is ROR, Really?
ROR is the percent change in value measured against capital at risk over a defined period. Both elements of that definition matter equally. Strip out the period and you cannot compare one investment against another. Strip out the base and you cannot tell whether a strong return came from skill or from a small denominator.
In practice: a $50,000 inventory investment that generates $7,500 in additional cash produces a 15% return for that period. Extend the measurement window from three months to twelve months on the same dollars and you get a different ROR entirely, because the denominator has not changed but the time frame has. The number is meaningless without both coordinates.
Consistent profit and expense categorization month-to-month is what makes ROR comparisons clean. If your chart of accounts shifts between periods, you are comparing different things even when the formula looks identical.
The Rate of Return Formula
The full formula accounts for every dollar in and every dollar out during the period:
ROR = (Ending Value + Cash Received – Costs Paid – Beginning Value) / Beginning Value
Most business owners stop at ending value minus beginning value. That misses two inputs that regularly move the number: distributions or interest received during the period, and platform fees or transaction costs paid to generate the return. Leaving either out gives you an incomplete picture.
Why Annualizing Changes Everything
When comparing investments that ran for different lengths of time, you need to annualize. The trap most owners fall into is dividing the total return by the number of years. That is the wrong method.
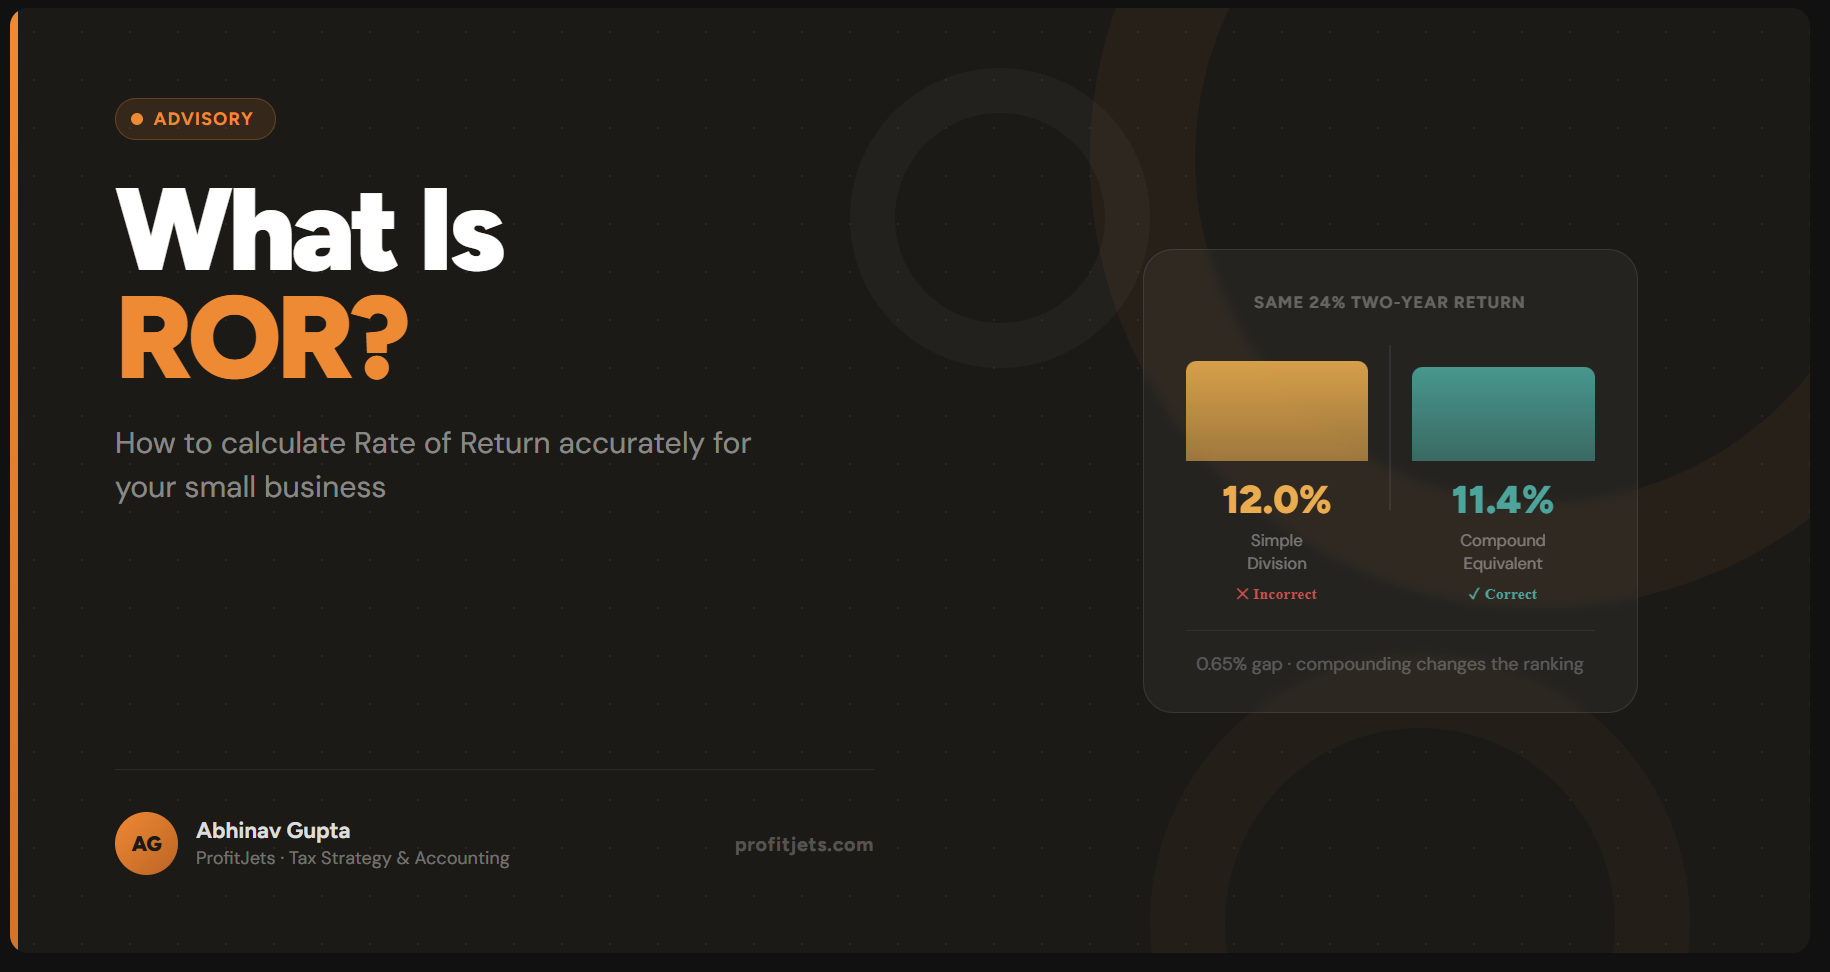
Returns compound. The correct annualized rate is the single yearly rate that, when applied and compounded repeatedly, produces the same total result. A 24% total return over two years is not 12% per year. The compound-equivalent rate is approximately 11.4%, calculated as (1.24)0.5 – 1. The gap looks small, but apply it across ten years of project comparisons and you will regularly mis-rank options.
| Method | Rate | Calculation | Note |
|---|---|---|---|
| Simple Division | 12.0% | 24% / 2 years | Overstates |
| Compound Equivalent | 11.4% | (1.24)^0.5 – 1 | Correct |
| Gap Between Methods | 0.6% | Compounds over time | Can flip rankings |
A 24% two-year return is not 12% per year. It is 11.35%. The formula is: (1 + total return)(1/years) – 1. Use this every time you annualize. Division produces a different ranking than compounding when comparing options of unequal length.
When Annualized ROR Misleads SMB Decisions
Annualizing a short-term gain creates a number that sounds extraordinary and means almost nothing. A 2% weekly gain, annualized correctly via compounding, is approximately 180%. No small business operates at 180% annual return across 52 consistent weeks. Pricing dynamics shift, key customers churn, vendors renegotiate. The conditions that produced the 2% do not repeat unchanged for a full year.
Annualized short-period returns are useful for one thing: spotting the best week in your year and calling it your business model. That is not a business model. It is a data selection problem.
Annualize only when the measurement period reflects steady, repeatable operating conditions. Avoid annualizing returns from one-time promotions, viral traffic spikes, singular vendor credits, or any period shorter than a full operating cycle for your business.
For short or irregular periods, use ROR on the actual holding period and validate in absolute dollars. A 6% return over 45 days is a 6% return over 45 days. State it that way, then check the dollar amount against your cost of capital for that 45-day window.
Cash Flows Break Simple ROR
Holding-period ROR works cleanly when there is a defined start, a defined finish, and no meaningful capital moving in or out between those two dates. The moment you add substantial contributions or owner withdrawals, simple ROR becomes unreliable. It treats dollars that were invested for three months identically to dollars invested for the full year, because the formula has no mechanism to account for when the money arrived or left.
A direct-to-consumer brand starts Q1 with $150,000 allocated to inventory. In May, it adds $100,000 for a summer line. In August, the owner takes a $60,000 distribution. Simple holding-period ROR either over-credits the early dollars for gains that came from the May injection, or understates performance by ignoring the distribution. Neither version is correct.
The rule is simple: if you cannot describe the period as “we invested X on day one and never adjusted it,” stop using holding-period ROR as your decision metric. Switch to money-weighted rate of return, which is aligned with IRR methodology and accounts for both the timing and the size of each cash flow.
ROI vs ROR vs IRR: When to Use Each
These three metrics are often used interchangeably. They should not be. Each answers a different question, and picking the wrong one for a capital decision produces rankings that look defensible but are mathematically wrong.
| Metric | Best For | Timing Sensitivity | Watch-outs |
|---|---|---|---|
| ROR | Reporting performance over a defined window | Low – assumes clear start/end, no meaningful flows | Must specify period and base. Breaks with mid-period contributions. |
| ROI | Simple project math over similar time spans | Medium – often ignores timing detail | Can mis-rank projects when timelines differ materially. |
| IRR | Cash flows moving in and out over time | High – built for timing and size of each cash flow | Sensitive to cash-flow assumptions. Do not use to artificially improve projections. |
A practical decision rule: if you can describe the investment as a single lump in and a single lump out with nothing in between, use ROR or ROI. If cash moved in and out at different points, use IRR. If you are comparing two projects with different durations, annualize correctly before comparing, or use IRR for both.
Need help measuring returns across multiple business investments?
Talk to a CFO AdvisorUsing ROR in Operating Choices
ROR becomes useful for operating decisions only when the return figure is tied directly to something that reconciles: cash received, margin earned, or capacity freed. A team celebrating strong ROR that did not produce more cash, more margin, or more capacity has defined the numerator too loosely. Letting each function choose its own return definition creates metrics that cannot be compared across the business.
Here is how to anchor ROR to real outputs by function:
- Marketing: Incremental contribution margin from attributed orders, not revenue. Revenue does not tell you what the campaign actually cost the business to fulfill.
- Hiring: Hours freed multiplied by billable rate, or measurable churn reduction value expressed in retained revenue.
- Inventory: Gross profit minus carrying costs and markdown risk. Both reduce the numerator and both are real.
- Equipment: Labor savings plus avoided downtime, net of maintenance obligations over the measurement period.
- Pricing changes: Incremental gross profit net of any volume lost to the price increase.
Frequently Asked Questions
Can ROR be negative?
Should I calculate ROR pre-tax or post-tax?
Is CAGR the same as annualized ROR?
What is the difference between annualized and average return?
How do I benchmark ROR for my business?
When should I switch from ROR to IRR?
Wrapping Up
Rate of return is the right tool for a specific job: measuring percent change over a defined period against a defined base. Name the period, name the base, include every cash flow, annualize with compounding not division, and switch to IRR the moment capital moves substantially during the measurement window. Get those mechanics right and ROR becomes a genuinely useful signal. Get them wrong and you are comparing different things while believing you are comparing the same thing.
Want a fractional CFO to build return metrics that actually drive decisions?
Schedule a Free ConsultationAnkit Sagatani
Ankit writes practical financial guides for small and mid-sized business owners, turning complex metrics into clear operating decisions.