Launching a business is exciting with mixed feelings all over. But, convincing your investors, banks, and partners that your business has real, scalable potential is a task for all startups.
Your Serviceable Addressable Market is the number that shows the realistic size of the opportunity in front of your business right now.
Most founders do the same thing before a big investor meeting. They find the largest, credible industry number they can, the global project management software market is worth $10 billion, the US healthcare industry is worth $4 trillion and they lead with it. This is just incomplete for your business.
But investors are not impressed by your TAM alone. They want to know how much of that market you can actually reach with your current product, your current team, and your current resources. That is where SAM comes in.

Here is what SAM is, how it fits into the broader market sizing framework, how to calculate it accurately, and how to grow it over time.
What Is a Serviceable Addressable Market (SAM)?
A Serviceable Addressable Market, also called a serviceable available market, is the portion of your Total Addressable Market (TAM) that your business can realistically target and serve, given your current business model, operational capabilities, geographic reach, and pricing.
Your SAM is the subset of potential customers who both need your product and fall within your realistic reach today.
If your TAM is the entire market, your SAM is the filtered version of that with the customers who:
- Need your product,
- Can afford your pricing,
- Fall within your operational reach, and
- Can actually be acquired through your channels.
For Instance,
If you sell premium accounting software designed for US-based startups with 10 to 100 employees, your TAM might be the entire global accounting software market. But your SAM is only the US startups in that size range, the customers your product was actually built for, that your sales team can reach, and that your pricing can serve.
How to Calculate SAM with Formula & Example
There is no single formula for calculating SAM. The right approach depends on your business model, the data available, and how mature your market intelligence is. The two most widely used methods are the top-down approach and the bottom-up approach.
Method 1: Top-Down Approach to Calculate SAM
The top-down approach starts with a large, established market figure from an industry report, government data, or a research firm and narrows it down by applying filters specific to your business.
How it works:
- Start with the TAM for your industry.
- Apply filters to remove segments you cannot serve such as wrong geography, wrong customer size, wrong use case.
- The remaining number is your SAM.
Use Case: Calculating SAM for a SaaS Startup
A SaaS company building project management software for architecture firms starts with the global project management software market with $10 billion as TAM. They then filter it:
- Only the US market (where they operate): reduces to $3 billion
- Only architecture, engineering, and construction firms: reduces to $800 million
- Only firms with 10 to 200 employees (their product’s fit): reduces to $200 million
Result: The remaining $200 million is their SAM.
The top-down approach is faster and easier, especially in early stages. Its weakness is that it relies on the quality of the market data you start with. If the original TAM figure is generic or outdated, your SAM will be wrong.
Method 2: Bottom-Up SAM Calculation Formula & Example
The bottom-up approach builds the SAM from the ground up using your own data with customer interviews, sales records, pricing, and direct market research. It is a time-intensive but significantly more credible approach.
The SAM formula for bottom-up:
SAM = Total Number of Potential Customers × % You Can Realistically Serve × Average Annual Revenue per Customer
Example: Bottom-Up SAM Calculation
A software company targets small businesses in the United States:
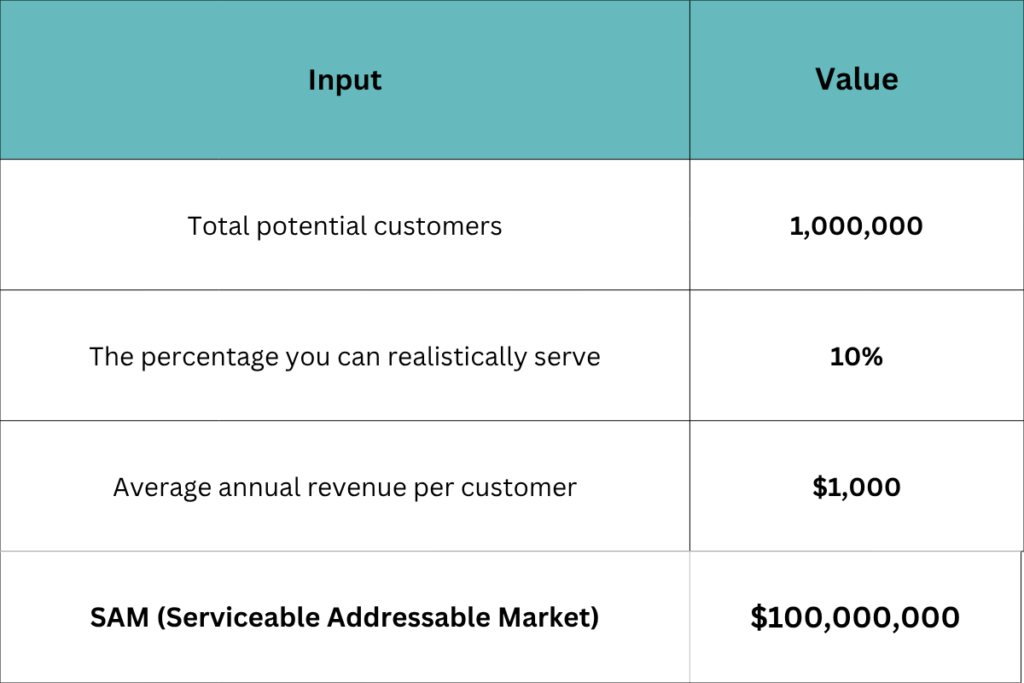
The bottom-up approach forces you to do the hard work of understanding your customer. How many of them exist? What percentage of them fit your product? What will they pay?
The answers to all of these questions give your SAM and the angle you should focus to build your business.
Which Method Should You Use?
For early-stage, where you have limited internal data, the top-down approach gets you started. But as your business matures and you accumulate real customer data, you should shift to a bottom-up approach or a combination of both.
Using both approaches and arriving at similar numbers is a strong signal that your SAM calculation is legit. Most founders struggle to translate market size into real numbers. That’s exactly where structured financial modeling makes the difference.
TAM, SAM, SOM: Calculating your market needs
SAM is the middle layer in a three-part market sizing framework that every serious investor expects founders to understand.
TAM (Total Addressable Market) is the total revenue opportunity that would exist if your product captured 100% of the market with zero competition and no constraints. It is the biggest number and the least actionable on its own.
SAM (Serviceable Addressable Market) is the realistic opportunity that is the portion of TAM you can actually pursue with your current product, distribution, and resources. This is your strategic focus area.
SOM (Serviceable Obtainable Market) is the near-term target, the share of your SAM you can realistically capture in the next one to three years, accounting for competition, brand recognition, and your go-to-market capacity.
A Simple Example
Imagine you manufacture wireless headphones.
- Your TAM is the entire global consumer electronics market worth hundreds of billions of dollars.
- Your SAM is the wireless headphone segment in the specific countries where you can actually manufacture, distribute, and support your product.
- Your SOM is the realistic share of that market your brand can capture in the next 1–2 years, based on your current marketing budget, partnerships, and reach.
Why SAM Matters More Than TAM to Investors
Here is a reality most founders learn too late is investors are rarely impressed by a massive TAM. A $500 billion TAM tells an investor almost nothing useful. It does not tell them whether your product is the right fit for a meaningful segment of that market. It does not tell them how you plan to get there, whether your revenue projections are grounded in anything real.
SAM does all of those things. When the investors look at SAM, they are searching answers for these questions:
1. Does this founder understand their real customer?
A well-constructed SAM shows that the team has thought carefully about exactly which customers they can serve, not just which customers theoretically exist.
2. Is the market large enough to deliver meaningful returns?
Investors need to know that the SAM is big enough to produce a business worth backing. Too small and the opportunity is not worth the risk. Too large and it looks fabricated.
3. Is this number growing over time?
SAM is also the number investors want to see evolving across funding rounds. If it is growing, it signals that the product is becoming relevant to a wider market and that positioning is working. A growing SAM is a sign of a company that is executing well.
The bottom line is that big numbers without logic do not convey anything about your business or product. Investors want to see how you arrived at your SAM, the methodology, the assumptions and the data sources.
Key Factors That Shape Your SAM
Several variables determine how large or small your SAM is. Understanding them helps you both calculate it accurately and identify where the opportunities to grow it exist.
1. Geographic reach
Your SAM is bounded by where you can realistically operate. A business without international shipping infrastructure cannot claim a global SAM. A service business without local presence cannot claim national reach.
2. Customer demographics and firmographics
Age, income, company size, industry, whatever characteristics define your ideal customer profile also define the boundaries of your SAM. Only include segments that genuinely fit your product.
3.Price point alignment
If your product is priced at $500 per month, customers who can only afford $50 per month are not part of your SAM regardless of how much they need the product. Pricing filters are real and must be applied.
4. Product fit
Your SAM only includes customers whose product can actually serve well today. A customer who needs a feature you have not built yet is not a current SAM customer, they may be a future one.
How to Grow Your SAM Over Time
As your business grows and your product evolves, your SAM can expand significantly. Here are the most effective ways to increase it.
✔ Expand geographically
Adding new markets brings a new pool of serviceable customers into range. Whether through owned infrastructure or third-party logistics partnerships, geographic expansion directly grows your SAM.
✔ Launch products at new price points
Serving one income segment caps your SAM. A lower-priced line opens the mid-market. A premium tier captures enterprise customers. Each new price point unlocks a new customer segment.
✔ Build distribution partnerships
Partnering with established retailers or channel partners gives you access to their customer base and distribution reach that is faster and more cost-effective than building it yourself.
✔ Develop new product capabilities
Every new feature that makes your product relevant to a previously unreachable segment increases your SAM. A payroll software company that adds healthcare compliance opens an entirely new vertical overnight.
Main Takeaway
Your SAM is the number that tells you where your business actually lives in the market. Not where it could theoretically reach if everything went perfectly, but where it can realistically operate and grow today.
Getting SAM right means resisting the temptation to include every possible customer and instead defining, with precision, who you can genuinely serve and how. That discipline is exactly what separates a credible market analysis from an inflated one.
Our team at Profitjets helps growth-stage businesses build financial clarity, from market sizing and unit economics to investor-ready financial models. If you are preparing for a fundraiser or want to pressure-test your SAM analysis, our team is ready to assist .
Frequently Asked Questions About Serviceable Addressable Market (SAM):
What is the biggest mistake when calculating SAM?
The most common mistake is presenting TAM as SAM or inflating the number without clear logic. Investors can spot this immediately. A smaller, well-explained SAM builds far more credibility than a large number that cannot be justified.
These mistakes make your numbers look inflated and reduce investor confidence
How do I calculate SAM if I don’t have real customer data yet?
Start with a top-down approach using industry reports, then apply realistic filters like location, target customer type, and pricing. Be clear about your assumptions. As you gather actual sales data, refine your SAM using a bottom-up method to make it more accurate and defensible.
Is SAM used in financial projections?
Yes, SAM plays a critical role in financial modeling. It acts as a realistic ceiling for revenue projections and helps estimate market share (SOM). Without SAM, revenue forecasts can become overly optimistic and disconnected from actual market opportunity.
How big should my SAM be for a venture-backed startup?
There is no fixed number, but your SAM should be large enough to support meaningful scale. Investors typically look for markets that can grow into $100M+ opportunities over time, with a clear path to expansion and increasing market share.
How often should I update my SAM as my business grows?
You should revisit your SAM at least once a year, but in reality, update it whenever something meaningful changes, new markets, pricing shifts, product expansion, or distribution channels.