Profit margin represents the portion of revenue that remains after all costs have been subtracted. Understanding how to calculate gross, operating, and net profit margin — and what each number tells you — is the foundation of every sound pricing and cost decision.
Key Takeaways
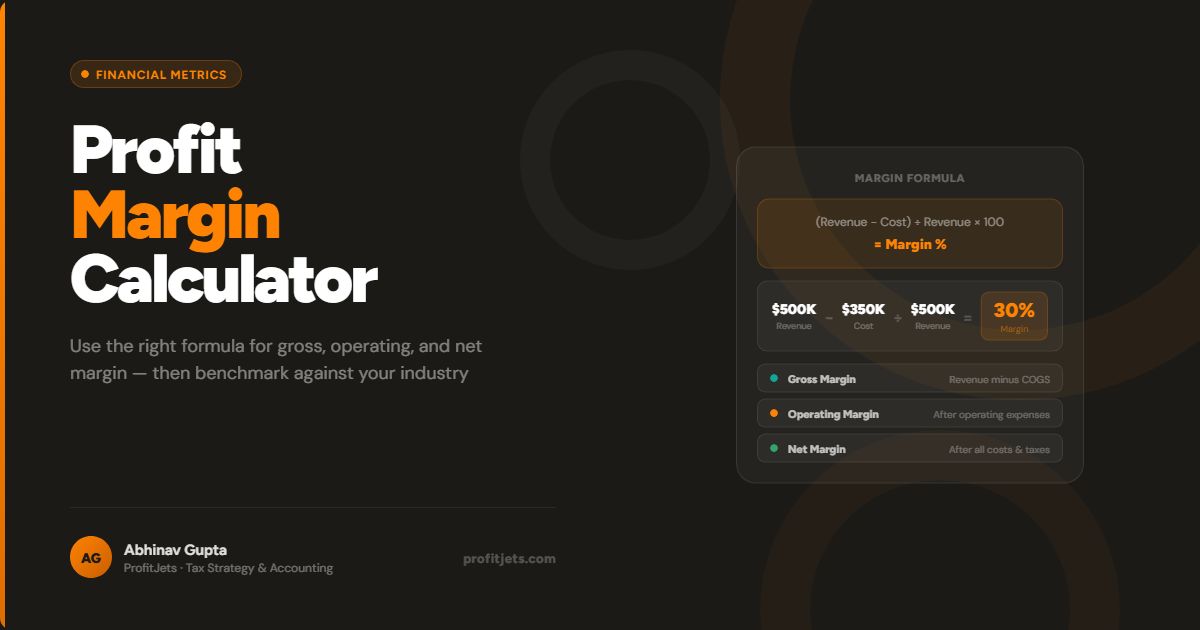
- Three margin types matter: gross (manufacturing efficiency), operating (pre-tax performance), and net (overall profitability).
- Gross margin formula: (Revenue – COGS) / Revenue x 100. On $100K revenue and $60K COGS, that is a 40% gross margin.
- Higher margins mean more efficient profit conversion; lower margins may signal operational inefficiencies worth investigating.
- You can improve margin by reducing costs, raising prices, or both — but clean financial data is a prerequisite to knowing which lever to pull.
Profit margin is the single clearest indicator of how efficiently your business converts revenue into profit. It strips away the noise of revenue growth and shows what you actually keep after costs. A business with $10M in revenue and a 2% net margin is less healthy than one with $2M in revenue and a 25% net margin. The margin is what matters.
This guide covers the three margin types every business owner should track, the formulas behind them, and how to use a profit margin calculator to make faster, more confident pricing and cost decisions.
What Is Profit Margin and Why It Matters
Profit margin represents the portion of revenue that remains after all costs have been subtracted. It is expressed as a percentage: a 20% net margin means that for every dollar of revenue, the business keeps 20 cents after all expenses.
Three primary margin types measure different layers of your cost structure:
- Gross profit margin evaluates manufacturing and production efficiency — how much is left after direct costs of goods sold
- Operating profit margin shows pre-tax earnings performance, including operating overhead but excluding interest and taxes
- Net profit margin reveals overall profitability after every expense, including interest and taxes
Higher margins indicate efficient profit conversion. Lower margins may signal operational inefficiencies, pricing problems, or a cost structure that needs review.
How to Calculate Profit Margin: The Essential Formulas
Gross profit margin
COGS includes all direct costs tied to producing your product or delivering your service: raw materials, direct labor, manufacturing overhead. It does not include selling, general, and administrative expenses.
Operating profit margin
Operating income is gross profit minus operating expenses (salaries, rent, utilities, marketing). This margin shows how efficiently your business runs before financing costs and taxes enter the picture.
Net profit margin
Net income is the bottom line: revenue minus every expense including COGS, operating expenses, interest, and taxes. This is the number that reflects what the business actually earned.
Worked Example
Revenue: $100,000 | COGS: $60,000
Gross profit: $100,000 – $60,000 = $40,000
Gross margin: $40,000 / $100,000 x 100 = 40%
If operating expenses add another $20,000, operating income = $20,000 and operating margin = 20%.
After $5,000 in interest and taxes, net income = $15,000 and net margin = 15%.
| Margin Type | Formula | Example Result | What it measures |
|---|---|---|---|
| Gross | (Rev – COGS) / Rev x 100 | 40% | Production efficiency |
| Operating | Op. Income / Rev x 100 | 20% | Core business performance |
| Net | Net Income / Rev x 100 | 15% | Overall profitability |
Using a Profit Margin Calculator
A profit margin calculator automates the formulas above by accepting inputs — revenue, COGS, operating expenses, and net income — and computing all three margin types instantly. For businesses making frequent pricing decisions or running scenario analysis, a calculator eliminates manual errors and speeds up the cycle from question to answer.
Use a profit margin calculator whenever you are evaluating a new price point, assessing a product line’s profitability, preparing for a lender conversation, or benchmarking your margins against industry peers. Speed matters when decisions need to move quickly.
The Revenue Calculator’s Role in Margin Planning
A revenue calculator works alongside your margin calculator to answer planning questions that go in the other direction: given a target margin, what revenue do you need? This supports four key planning activities:
- Financial forecasting — model what margin looks like at different revenue levels
- Scenario analysis — test how margin changes if COGS rises 10% or a product mix shifts
- Business budgeting — set spending targets that protect your target net margin
- Decision making — evaluate whether a new contract, product, or channel is worth pursuing
How to Use a Profit Margin Calculator Step by Step
- Input revenue data. Enter gross revenue for the period — do not net out returns or discounts until the COGS line.
- Enter expense information. Input COGS separately from operating expenses so the calculator can produce all three margin types, not just net.
- Select the appropriate formula. For a product business, start with gross margin. For a service business with minimal COGS, operating margin is often more meaningful.
- Review the output. Compare all three margin percentages and identify which layer has the most room for improvement.
- Run scenarios. Adjust one input at a time — what happens if you raise prices by 5%? Reduce COGS by 8%? This is where calculators pay off.
How to Improve Your Profit Margin
Margin improvement comes from two directions: increasing revenue or reducing costs. In practice, the most durable improvements combine both. Here are the highest-impact levers:
- Review pricing regularly. Many small businesses undercharge. Even a 5% price increase with no volume loss flows directly to gross margin.
- Audit COGS quarterly. Supplier prices rise, waste accumulates, and production inefficiencies creep in. A quarterly COGS review catches these before they compound.
- Cut low-margin products or services. Not all revenue is equal. A product line with a 10% gross margin drags down your blended margin. Consider repricing or discontinuing it.
- Reduce operating overhead. Fixed costs (office space, software subscriptions, headcount) that are not tied to revenue growth reduce operating margin. Audit annually.
- Optimize the revenue mix. Shift sales toward higher-margin products and services without necessarily growing total revenue.
Cost cuts that reduce product quality or service delivery can trigger churn and lower revenue. Always model the second-order effects before making significant cost reductions. The goal is durable margin improvement, not a one-quarter spike.
How Professional Services Enhance Profitability
Accurate margin analysis depends on accurately categorized financials. Misclassified expenses distort all three margin calculations and can lead to wrong decisions. Professional accounting services add direct value here:
- Outsourced bookkeeping maintains accurate, consistently categorized records that make margin calculations reliable period over period.
- Tax services identify deductions and structures that improve after-tax net margin without changing top-line revenue.
- CFO services translate margin data into strategic recommendations — where to invest for margin improvement, which product lines to grow or exit, and how to present margins to investors or lenders.
Want to know which of your products or services is actually driving margin — and which is dragging it down?
Talk to a ProfitJets CFO AdvisorFrequently Asked Questions
What is a profit margin calculator used for?
How do you calculate profit margin?
Why is profit margin significant?
Can I improve my profit margin?
What is a good profit margin for a small business?
Ready to get accurate, consistently categorized financials that make margin analysis reliable?
Schedule a Free ConsultationProfitJets Editorial Team
The ProfitJets team writes practical finance guides for small and mid-sized business owners navigating growth, reporting, and strategic decisions.