
Most often, small business owners only focus on two financial indicators, revenue and the bank balance. The former helps ascertain whether their sales are growing, and the latter tells if the bills due this week will be covered.
Notwithstanding the apparent importance of these two metrics, there are other ratios that may be equally valuable to business owners in ascertaining the state of their finances. Specifically, there are financial ratios that reflect the relationship between two numbers from the income statement or balance sheet.
Taken together, these ratios indicate if the business can cover its liabilities, how much profit is generated per unit sold, whether the customers pay on time, and if the company is too dependent on debt. All of these ratios require no special financial expertise to calculate, given that the computations are based on easily accessible data, such as the monthly income statement, and a bit of time and attention.
The seven ratios described in the module above are liquidity, profitability, leverage, collection, and cash. These ratios are useful because they are updated on a monthly basis, thus allowing business owners to spot issues before they become critical.
The ratio I wish more owners tracked is days sales outstanding. I've seen profitable businesses nearly miss payroll because customers slowly moved from paying in 30 days to paying in 55, and nobody noticed. Revenue kept growing, so the owner assumed things were fine, but more and more of that revenue sat in unpaid invoices. A single number, reviewed monthly, would have flagged the drift months before the bank balance did. It takes five minutes to calculate, and it's often the first sign of a cash problem on its way.
Abhinav Gupta, CPA, CA, MBA · LinkedIn1. Current Ratio (Liquidity)
- Formula: Current Assets / Current Liabilities
- What it tells you: Can you pay your short-term bills? A ratio above 1.0 means current assets exceed current liabilities.
| Current Ratio | Interpretation |
|---|---|
| Below 1.0 | Danger zone, current liabilities exceed current assets; cash crunch risk |
| 1.0 to 1.5 | Acceptable but tight, limited buffer for unexpected expenses |
| 1.5 to 2.0 | Healthy, standard benchmark for most SMEs |
| Above 3.0 | May indicate idle cash that could be better deployed |
For instance, an analysis of these ratios can help identify impending liquidity problems, which may help the owner avert business failure. This is especially important because cash flow issues are the primary culprit in business failure, and they are barely visible when only the income statement is reviewed.
2. Quick Ratio (Acid Test)
- Formula: (Current Assets − Inventory) / Current Liabilities
- What it tells you: Same as current ratio but strips out inventory (less liquid). Healthy benchmark: 1.0x or above. Businesses with high inventory (retailers, manufacturers) often show lower quick ratios than their current ratio suggests.
3. Gross Margin (%)
- Formula: (Revenue − COGS) / Revenue × 100
- What it tells you: How much of each dollar of revenue remains after direct production costs. Compare to your industry benchmark (see the gross-margin-vs-gross-profit post). Gross margin dropping over time signals rising input costs or pricing pressure.
4. Net Profit Margin (%)
- Formula: Net Income / Revenue × 100
- What it tells you: The bottom-line return on every dollar of revenue after all costs. Varies widely by industry (SaaS 15 to 30%; retail 2 to 5%). Track it monthly, a declining trend needs investigation even if the absolute margin looks acceptable.
5. Debt-to-Equity Ratio
- Formula: Total Liabilities / Total Equity
- What it tells you: How much of the business is funded by debt vs owner capital. Healthy range for most SMEs: 1.0x, 2.0x. Above 2.0x increases lender scrutiny and financial fragility. See the debt-to-equity-ratio post for full detail.
6. Days Sales Outstanding (DSO)
- Formula: (Accounts Receivable / Monthly Revenue) × 30
- What it tells you: How long it takes customers to pay after you invoice. Compare to your payment terms. A DSO significantly above your terms means customers are paying late, a cash flow risk even in a profitable business.
7. Accounts Receivable Turnover
- Formula: Net Credit Sales / Average Accounts Receivable
- What it tells you: How many times per year you collect your average receivable balance. A higher number = faster collections = better cash flow. Compare quarter-over-quarter to spot deteriorating collections.
Quick Reference: All 7 Ratios
| Ratio | Formula | Healthy Range | Watch For |
|---|---|---|---|
| Current Ratio | Current Assets / Current Liabilities | 1.5 to 2.0x | Below 1.0 = liquidity risk |
| Quick Ratio | (Current Assets − Inventory) / Current Liabilities | 1.0x+ | Below 0.8 = cash pressure |
| Gross Margin | (Revenue − COGS) / Revenue × 100 | Industry-specific | Declining trend |
| Net Profit Margin | Net Income / Revenue × 100 | Industry-specific | Declining or negative |
| Debt-to-Equity | Total Liabilities / Total Equity | 1.0x, 2.0x | Above 2.0x for most SMEs |
| DSO | (Receivables / Monthly Revenue) × 30 | Within 10-15 days of terms | DSO > payment terms |
| AR Turnover | Net Credit Sales / Avg Receivables | Higher = better | Declining trend |
We were mainly watching monthly revenue and the bank balance, so the business looked healthy on the surface. Once Profitjets started tracking our DSO, we realized customers were taking much longer to pay than they had been, which was putting pressure on our cash flow. We tightened our payment terms and follow-up process, and within a few months our collections became much more predictable.
Book a free consultation and we will build you the scorecard.
FAQs
How often should I calculate financial ratios?
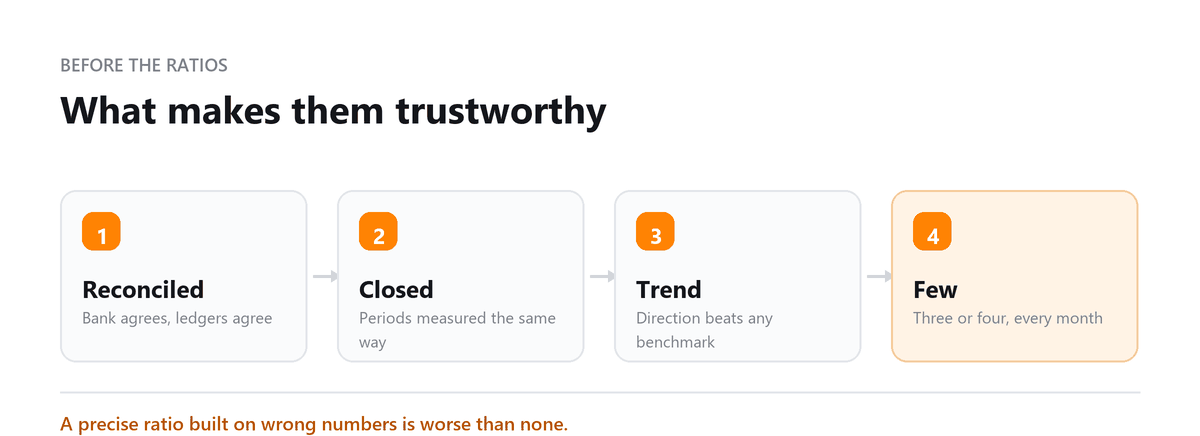
Monthly is best for most small businesses, as part of the month-end close. Liquidity and collection ratios such as the current ratio, quick ratio, and DSO can change quickly and need regular attention. Margins and debt-to-equity move more slowly, but reviewing them monthly makes trends easier to spot.
Where do I find the numbers for these ratios?
Everything comes from your balance sheet, income statement, and cash flow statement. QuickBooks, Xero, and most accounting software produce all three. The ratios are only reliable if the books are reconciled and up to date, so calculate them after month-end close, not from mid-month figures.
What if one of my ratios looks bad?
Look at the trend and the cause before reacting. A single weak month can come from timing, such as a large bill paid early or a customer payment arriving a few days late. A ratio that worsens month after month points to something structural, such as pricing, collections, or borrowing, and that's where to focus.
Are there industry benchmarks for these ratios?
Yes, but use them carefully. Industry surveys and lender guidelines publish typical ranges, and those can help put your numbers in context. Your own trend over time, and the specific requirements in any loan agreement, usually matter more than a general benchmark.
Which ratio should I start with if I only track one?
For most small businesses, days sales outstanding or the operating cash flow ratio. Both focus on cash, which is what actually runs out. Once those are in place, add the current ratio and gross margin to build a fuller picture.

Written by
Abhinav Gupta, CPA, CA, MBA
Abhinav works with business owners across the US on industry-specific bookkeeping, from dental practices and restaurants to construction and e-commerce. He writes about what each trade's books actually need. Connect on LinkedIn
Free consultation
No Monthly Numbers to Read?
Book a free consultation and we will build you the scorecard.