The current ratio and quick ratio are the two most important liquidity metrics every business owner should track. While profits can look healthy on paper, these ratios reveal whether your business can actually meet short-term obligations without disruption. One month, receivables are slow, a vendor demands early payment, and suddenly the business that looked fine on paper is scrambling to cover payroll.
This is exactly where the current ratio and quick ratio become essential. These are the early warning signals of financial stress. While the current ratio provides a broad view of short-term liquidity, the quick ratio strips it down to what truly matters: assets that can be converted into cash quickly.
Together, the current ratio and quick ratio give you a realistic view of whether your business can meet its obligations without disruption. Tracking them consistently, will give you the clarity to act before a cash crunch turns into a crisis. They measure your short-term liquidity, your ability to cover immediate financial obligations without selling assets, taking on new debt, or calling in favors.

What Is the Current Ratio and What Does It Measure
The current ratio compares everything your business expects to convert into cash within the next 12 months against everything it owes within the same period.
Current Ratio = Current Assets ÷ Current Liabilities
- Current assets include cash, accounts receivable, inventory, prepaid expenses, and short-term investments.
- Current liabilities include accounts payable, short-term loans, accrued salaries and taxes, and the current portion of any long-term debt.
Using a simple example: if your business has $180,000 in current assets and $120,000 in current liabilities, your current ratio is 1.5. For every dollar you owe in the next 12 months, you have $1.50 available to cover it.
How to Interpret the Current Ratio
The current ratio indicates a company’s ability to meet short-term obligations using short-term assets. The current ratio is best used alongside other financial ratios to get a complete view of short-term financial health. While the ideal range varies by industry, the following benchmarks provide a practical guide:
a) Above 1.0 → Short-term Financial Stability
A ratio above 1.0 means your short-term assets exceed your short-term obligations, confirming you are technically solvent on a short-term basis. It is the minimum threshold every business should maintain. Falling below this point means your current liabilities are outpacing available resources regardless of what your profit and loss statement says.
b) 1.5 to 2.0 → Healthy Range for Most Industries
This means you have a comfortable buffer to cover short-term obligations without stretching your resources. For most small businesses, maintaining a ratio within this range signals sound financial management and operational stability.
c) Below 1.2 → Potential Liquidity Risk
A current ratio below 1.2 warrants immediate attention. At this level, your cushion between assets and liabilities is thin, leaving little room for unexpected expenses, or a sudden drop in revenue.
d) Above 2.5 → Possible Inefficiency
While a high current ratio may appear positive, a figure above 2.5 can suggest the business is sitting on too much idle cash or carrying excess inventory that is not being put to productive use. Capital that could be reinvested into growth, operations, or debt reduction is effectively sitting dormant which is a concern for investors evaluating how efficiently the business deploys its resources.
What Is the Quick Ratio and Why Is It More Accurate
The quick ratio strips out inventory and prepaid expenses, leaving only the assets that can be converted to cash quickly usually within 90 days. This gives you a more realistic picture of immediate liquidity.
Quick Ratio = (Cash + Accounts Receivable + Short-Term Investments) ÷ Current Liabilities
Some analysts calculate it as:
Quick Ratio = (Current Assets − Inventory − Prepaid Expenses) ÷ Current Liabilities
Both formulas arrive at the same result. Using the example above: if that same business has $180,000 in current assets but $80,000 of that is inventory and $10,000 is prepaid expenses, the quick assets are $90,000. Against $120,000 in current liabilities, the quick ratio is 0.75.
That’s a materially different picture than the current ratio of 1.5 suggested. The business looks liquid until you remove the assets it can’t easily spend. This becomes even more important when you consider regulatory and tax reporting standards outlined under IRS Small Business Tax Resources especially for growing businesses.
What’s a Good Quick Ratio for Your Business
A quick ratio of 1.0 or above is the general benchmark, it means you can cover current liabilities using only liquid assets, without touching inventory. For most businesses, 1.0 to 1.5 is considered solid.
Below 1.0 doesn’t automatically mean crisis. Grocery retailers, for example, routinely operate with low quick ratios because they collect cash at the point of sale before paying suppliers. Their operating model effectively inverts the normal timing of cash flows. For these businesses, a quick ratio of 0.5 to 0.7 can be sustainable.
For most other businesses such as professional services, B2B companies, e-commerce brands, SaaS companies, a quick ratio below 0.8 warrants a close look at receivables aging, inventory management, and upcoming obligations.
Current Ratio vs Quick Ratio: What the Difference Reveals
The comparison between the current ratio vs quick ratio is where meaningful financial insight emerges.
- The current ratio provides a broad view of liquidity
- The quick ratio reveals immediate financial strength
The gap between the two indicates how much of your liquidity is tied up in inventory or less liquid assets.
A small gap suggests strong liquidity and efficient operations. A large gap signals potential risk—often hidden beneath otherwise healthy-looking numbers.
Real Example: Current Ratio vs Quick Ratio in Practice
Consider four businesses, each with the same current ratio of 1.8, but very different quick ratios. Here is what the numbers actually reveal:
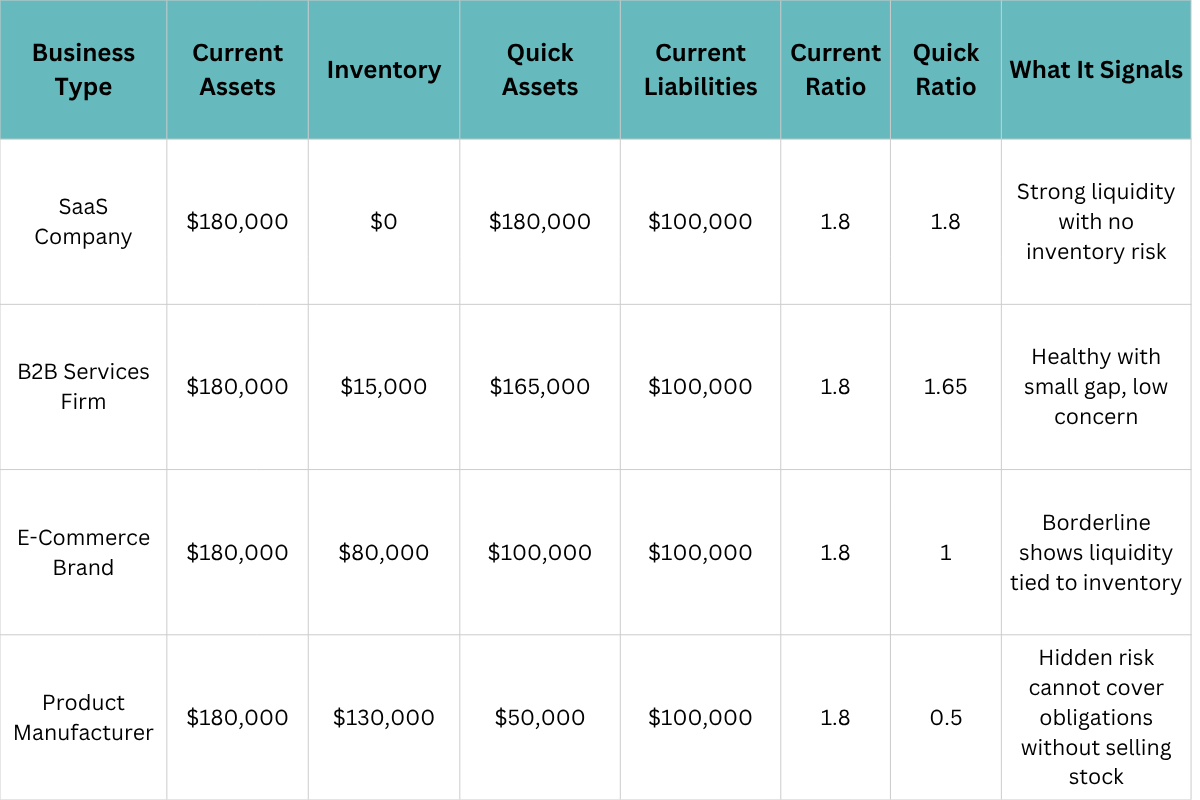
What this example shows
All four businesses have an identical current ratio of 1.8, which looks healthy on paper. But the quick ratio tells four completely different stories. The SaaS company carries no inventory, so both ratios align and liquidity is genuine. The product manufacturer, despite appearing equally stable, can only cover 50 cents of every dollar owed using liquid assets alone.
This is the exact scenario where a business passes a surface-level financial review but fails the moment a cash crunch arrives a slow month, a supplier demanding early payment, or a large receivable that doesn’t come in on time.
A large gap between your current ratio and quick ratio is a signal that your apparent liquidity depends heavily on assets you cannot spend quickly. The wider the gap, the more fragile your financial position actually is beneath the headline figure.
4 Reasons Why Your Current and Quick Ratios Deteriorate
Here are the reasons why your current ratio and quick ratio falls short:
1 Receivables aging without intervention
Invoices that stretch to 60, 90, or 120 days don’t disappear from your current assets, they’re still counted as if they’ll be collected. But if a significant portion of your accounts receivable is unlikely to be paid on time, your quick ratio is overstated. Monitoring receivables aging alongside these ratios is essential.
2 Inventory buildup without corresponding sales
Growth-stage product businesses often over-order to avoid stockouts, which inflates current assets without improving genuine liquidity. The current ratio rises while the quick ratio stays flat is a warning sign that’s easy to miss if you’re only watching one number.
3 Short-term debt funding long-term needs
Using a line of credit to purchase equipment or fund a long-term project moves an asset off the current section while leaving the liability right where it is. The ratios compress and the root cause isn’t always obvious which is why tracking key financial metrics together gives a far more accurate picture of your business’s health.
4 Seasonal fluctuation
Businesses with revenue concentrated in certain months can have excellent ratios in strong periods and alarming ratios in off-seasons. Reviewing these ratios only once a year or only before a financing event misses this pattern entirely.
Why Businesses Must Track Both the Current Ratio and Quick Ratio
The current ratio gives you the wide view. The quick ratio sharpens it. A business that only tracks one of these is working with incomplete information.
The most useful signal is the gap between them.
- A small gap suggests your inventory turns quickly and doesn’t represent a meaningful liquidity risk.
- A large gap is where the current ratio is strong but the quick ratio is weak. It tells you that the apparent liquidity on your balance sheet is more fragile than it looks. That fragility is exactly what a cash crunch exposes.
The current ratio includes inventory in the numerator. That’s fine when inventory turns quickly. It’s a problem when inventory sits on shelves for months, is subject to spoilage, or is only sellable at a discount.
How Profitjets Helps You Stay Ahead of a Cash Crunch
Liquidity issues do not emerge all of a sudden, they build quiet The difference between reacting late and acting early comes down to whether you are tracking the right numbers consistently. Also, knowing your current ratio and quick ratio is the start. Acting on what they reveal is where most businesses need support.
At Profitjets, we build the financial reporting systems that make these metrics visible on a regular basis, not just when you’re applying for financing or preparing investor materials.
That means monthly balance sheets, receivables aging reports, and cash flow forecasts that give you real warning when a liquidity squeeze is building before it arrives.